Q2) Implementing a Bayesian network in R and performing inference
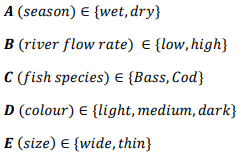
A belief network models the relation between the variables A, B, C, D and E, which represents the season, river flow rate, fish species, color and size respectively. Each variable takes different states as given below.
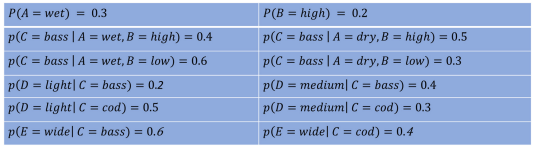
The belief network that models these variables has (probability) tables as shown below.
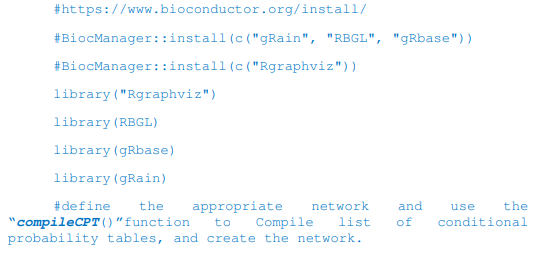
2.1) Use the below libraries in R to create this belief network in R along with the probability values, as shown in the above table.
You may use the following libraries for this:
a) Show the obtained belief network for this distribution
b) Show the probability tables obtained from the R output, (and verify with the above table).
2.2) Use R program to compute the following probabilities:
a) Given that the river flow rate is low, what is the probability that size is thin?
b) Given that the colour is dark and the season is dry, what is the probability that the fish species is Cod?
c) Find the joint distribution of colour and fish species.
d) Find the marginal distribution of fish species.
Students succeed in their courses by connecting and communicating with an expert until they receive help on their questions

Consult our trusted tutors.


 Login | Sign Up

